

Data cleaning is an important part of data science, but it can sometimes be confusing. Have you ever seen messy text in your data? Do you wonder what to do when some values are missing? Have you struggled with fixing dates that don’t look right? Or maybe you’ve noticed that some data entries don’t match.
In this course, you’ll learn why these problems happen and, most importantly, how to fix them! You will practice solving real-world data-cleaning challenges through five hands-on exercises.
In this lesson, we will start by learning how to handle missing values in data.
Let’s Have a Look at the Data
Before we start cleaning the data, we need to load the necessary tools (libraries) and the dataset we’ll be working with.
For this example, we’ll use a dataset that contains events from American Football games. Later, you’ll get a chance to practice your skills on a different dataset about building permits in San Francisco.
Getting Started with Your Notebook and Data
To begin working with data, you first need a place to write and run your code. For that, we are going to use Kaggle. In Kaggle, you can do this by creating a new notebook.

Once your notebook is ready, you’ll see an interface like this. Let’s give our new notebook a proper name for it would be easier to find out later.

Alright! The next step is to import a dataset. Kaggle provides many datasets that you can easily add to your project. You can load a dataset into your notebook using Python libraries like pandas, which helps you view and work with data in a structured way.
Step 1: Importing a dataset to work with
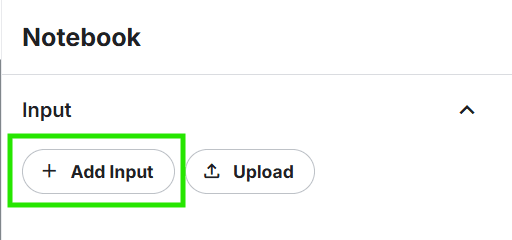
You’ll see a section for importing data in the right-hand corner of the notebook. Click on “Add Input” to import a dataset from Kaggle itself or you can Upload one of your own with the Upload button.
Here in this exercise, we are gonna use one from Kaggle.
Search for the term “https://www.kaggle.com/datasets/maxhorowitz/nflplaybyplay2009to2016” on the search bar and click on the + icon to add the dataset to the workspace.

Step 2: Use that dataset in the Workspace
To start working with our dataset, we need to import the necessary libraries. We will use pandas to handle and analyze data in a table format and numpy for numerical operations.
Next, we will load the dataset using pd.read_csv(), which reads data from a CSV file and stores it in a variable.
Finally, we set a random seed using np.random.seed(0). This ensures that if we use random values in our analysis, we get the same results each time we run the code, making our work more consistent and reproducible.
import pandas as pd
import numpy as np

# read in all our data
nfl_data = pd.read_csv("../input/nflplaybyplay2009to2016/NFL Play by Play 2009-2017 (v4).csv")

# set seed for reproducibility
np.random.seed(0)
The first step after loading a dataset is to take a quick look at its contents. This helps ensure that the data was loaded correctly and gives us a basic understanding of its structure. One important thing to check is whether there are any missing values, which are gaps where data is unavailable.
In Python, missing values are usually represented as NaN (Not a Number) or None. Identifying these gaps early is important because they can affect data analysis and decision-making.
Let’s look at the first 5 rows of the dataset we just imported.
nfl_data.head()

It looks like our dataset contains some missing values.
Now, the next step is to find out how many data points are missing. To do this, we will check each column individually and count the missing values. This will help us understand which parts of our dataset need cleaning and decide how to handle the missing data effectively.
Let’s see how many missing values we are dealing with here in each column of the table.
missing_values_count = nfl_data.isnull().sum()
To make this easier, let us just consider the first 10 columns.
missing_values_count[0:10]
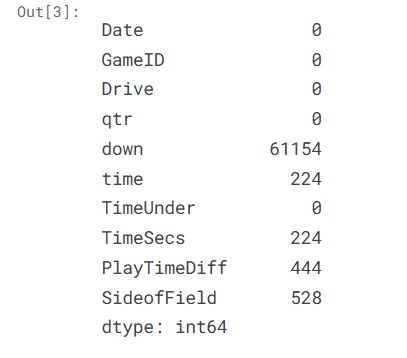
That seems like a lot! To better understand the impact, it’s useful to calculate the percentage of missing values in the dataset. This helps us see how much of the data is incomplete and whether the missing values are a small issue or a major problem that needs attention.
By looking at the percentage, we can make informed decisions on how to handle the missing data efficiently.
# how many total missing values do we have?
total_cells = np.product(nfl_data.shape)
total_missing = missing_values_count.sum()

# percent of data that is missing
percent_missing = (total_missing/total_cells) * 100
print(percent_missing)
You’ll be surprised to see that almost one-fourth of the dataset is missing! This could affect our analysis, so the next step is to take a closer look at the columns with missing values. By examining these columns, we can try to understand why data is missing and decide on the best way to handle it. This will help us clean the dataset and make it more useful for analysis.
why the data is missing?
At this stage, we start using what I like to call “data intuition”—really analyzing the data to understand why certain values are missing and how that impacts our analysis. This can be a challenging part of data science, especially for beginners, but it’s also one of the most important skills to develop.
When dealing with missing values, a key question to ask is:
Is this value missing because it wasn’t recorded, or because it doesn’t exist?
- If a value doesn’t exist (like a delivery time for an order that was canceled or the height of the oldest child of someone who has no children), it wouldn’t make sense to fill it in. In such cases, keeping it as NaN is the best choice.
- If a value is missing because it wasn’t recorded, we might be able to estimate it based on other available data. This process is called imputation, and we’ll learn how to do it next!
Let’s look at an example from our dataset. I’m going to look at the first 10 columns of the dataset to see whether there are any missing values. We just used it above.
missing_values_count[0:10]

The “TimeSecs” column nfl_data has a lot of missing values. Let’s explore why and decide the best way to handle them.
By checking the dataset documentation, we can see that the “TimeSecs” column represents the number of seconds left in the game when a play was made. Since these values were likely not recorded rather than being nonexistent, it makes sense to try and estimate (impute) them rather than leaving them empty.
However, other columns, like “PenalizedTeam,” have missing values for a different reason. If no penalty occurred during a play, there wouldn’t be a team to record in this column. In this case, it makes more sense to either leave the values empty or replace them with a label like “neither” instead of trying to guess a value.
👉 Tip: Always check the dataset documentation to understand what each column means! If the dataset comes from another person or organization, reaching out to them can also help clarify missing data issues.
For a detailed data analysis, we would ideally examine each column separately to decide the best way to handle missing values. However, for now, we’ll focus on some quick and simple techniques that help deal with missing values efficiently—though they may sometimes remove useful information or introduce slight inaccuracies.
Dropping the Missing Values
If you’re in a hurry or don’t have time to investigate why values are missing, one quick solution is to remove rows or columns that contain missing values. However, this isn’t always the best approach—especially for important projects—because it can result in losing valuable data.
For a more thorough analysis, it’s usually better to take the time to examine each column individually and understand why the data is missing before deciding how to handle it.
But if you’re sure that dropping missing values is the best option, pandas provides a simple function called dropna(), which removes rows with missing values. Let’s try it out on our NFL dataset! 🚀
nfl_data.dropna()

Looks like we lost all the data 😂. It looks like removing rows with missing values deleted all our data because every row had at least one missing value.
Instead of removing rows, a better approach might be to remove columns that contain missing values. This way, we keep most of our data while only losing a few columns that might not be essential for our analysis. Let’s give that a try next!
columns_with_na_dropped = nfl_data.dropna(axis=1)
columns_with_na_dropped.head()

Mmm! This one is better, We’ve lost quite a bit of data, but at this point, we have successfully removed all the NaN‘s from our data.
Let’s try something that does not involve deleting the rows or the columns. Because sometimes, we need them to be there.
Filling in missing values automatically (Imputation)
Another way to handle missing data is to fill in the missing values instead of removing them. This method helps retain more data, making analysis more accurate. To demonstrate this, we’ll take a small section of the NFL dataset, so it’s easier to view and understand how filling in missing values works.
For that, I’m going to get a smaller subset of the dataset, starting from the column ‘EPA’ to the ‘Season’. Here’s how you do it.
subset_nfl_data = nfl_data.loc[:, 'EPA':'Season'].head()
subset_nfl_data

We can use Panda’s fillna() function to fill in missing values in a data frame for us. One option we have is to specify what we want the NaN values to be replaced with. Here, I’m saying that I would like to replace all the NaN values with 0.
subset_nfl_data.fillna(0)

See, everything before it was a NaN is now replaced with the Zero.
Another smart way to fill in missing values is to replace them with the value that comes directly after them in the same column. This method works well for datasets where the data follows a logical order, such as time series data or sequential observations.
This makes a lot of sense for datasets where the observations have some sort of logical order to them.
subset_nfl_data.fillna(method='bfill', axis=0).fillna(0)

The Bottom Line
Handling missing values is an important step in data cleaning, and there are several ways to approach it. We can remove missing values by dropping rows or columns, but this may lead to significant data loss. Alternatively, we can fill in missing values using methods like replacing them with a fixed value (e.g., 0) or using values from surrounding data points.
The best method depends on the dataset and the type of analysis we want to perform. Taking the time to understand why data is missing helps us make better decisions and ensures that our cleaned dataset is as accurate and useful as possible. With these techniques, we can confidently prepare our data for deeper analysis!